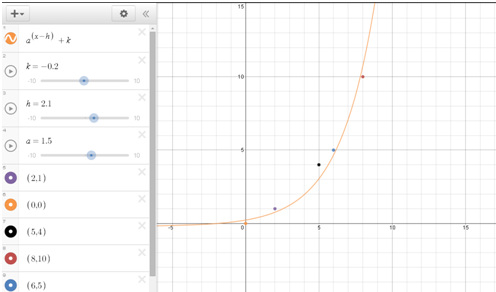
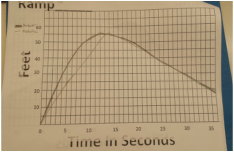
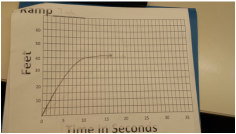
The Function that Follows is an exponential graph. The Domain of this graph is X≥ 0. The range of this graph is y≥ 0. I don't think this would change the domain or range because the graph should never go negative. yes there is a problem with applying the continuous function because there will be a point were the graph levels off and sales stop going up.
No I do not think that the ball will go in the hoop. I think that the ball will hit the rim and bounce out. based on where it looks like it will hit. I used desmos to crate a graph. I used the line y= -.17x^2+2.3 to figure this out.
My graphs were pretty close, the only thing that I had that was off was the shape i drew a V and the real graphs were mainly U shapes. The zeros represent when the skateboard is not moving and when it stops. Each graph had a different maximum, the graph with the highest maximum was the 21 inch ramp, the maximum of this graph was around 63 feet. The graph with the second highest maximum was the one that used the 14 inch ramp, the maximum of this graph was around 56 feet. The 7 inch ramp had a graph with a maximum of about 42 and then level of and stayed at the same number. The graph moves the fastest when it is first coming off of the ramp. The graph is falling the fastest when it is first descending then it levels off. The graph moves the fastest when it is first coming off the ramp because it has the most momentum then and same when it is first stating to descend.
The first thing I did when adding to the smiley face was to add hair, I did this by typing in a quadratic function line. To make the hair the size that I wanted I made the domain restricted. Then i added some sunglasses by using a quadratic function to form the circles. To form the frames I used the identity function. To make the hat I used vertical and horizontal lines. I then made the hat shaded with a greater than or equal to sign so that the lines would stay solid. I then made the hat polka doted by using two quadratic functions in one formula bar. I added some eyebrows by using horizontal lines for example y=4. I also added a horizontal line to the smile to make it bigger.
What I found challenging about this project was first learning how to use desmos, but as I kept playing with it and adding stuff to the smiley face it got easier and easier. From this project I learned how to use desmos and make cool looking pictures with different kinds of lines. 1. a. pulling the flag at a constant speed
b. pulling the flag at a constant speed then slowing down once you get to the top c. pulling the flag with a hand stopping pulling the flag with the opposite hand and stopping and continuing this motion d. start raising it slow at first then go a little bit slower e. start raising it slow then speed up and then slow down again f. raise the flag supper fast ( this wouldn't be possible) 2. the graph that shows the most realistic situation is A because it is pulled at a constant speed 3. F is the least realistic because you cant pull the flag up at one moment it take more time |
Archives
December 2015
Categories |