  | 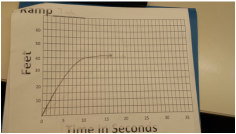 |
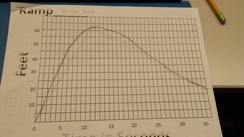
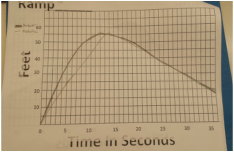
My graphs were pretty close, the only thing that I had that was off was the shape i drew a V and the real graphs were mainly U shapes. The zeros represent when the skateboard is not moving and when it stops. Each graph had a different maximum, the graph with the highest maximum was the 21 inch ramp, the maximum of this graph was around 63 feet. The graph with the second highest maximum was the one that used the 14 inch ramp, the maximum of this graph was around 56 feet. The 7 inch ramp had a graph with a maximum of about 42 and then level of and stayed at the same number. The graph moves the fastest when it is first coming off of the ramp. The graph is falling the fastest when it is first descending then it levels off. The graph moves the fastest when it is first coming off the ramp because it has the most momentum then and same when it is first stating to descend.
 RSS Feed
